


About data visualization and Splunk apps
The best method to explain the significance of information is to display it in a visual context.
Recently we have created an add-on for our SIEM Splunk to make data flow from Eset Remote Administrator antivirus more optimized and readable. And now it’s time to visualize data from this source.
To resolve this issue our team of engineers created an application for Splunk. In general, application for SIEM provides data visualization by using statistic tables, pie and column charts, gauges, maps and other visualizations.
Shortly about app
This Splunk Application for Eset Remote Administrator can help you detect new threats faster than doing it manually because all the data will be already visualized.
This App provides visualized information about the last activity of computers, detailed statistics about threats, firewall and HIPS events and generates short reports.
Also, App provides functionality for administrators, such as Audit events about Eset Admin Panel usage.
As a bonus, App provides “Requirements check” to check the availability of all dependencies.
App Description
Dashboards
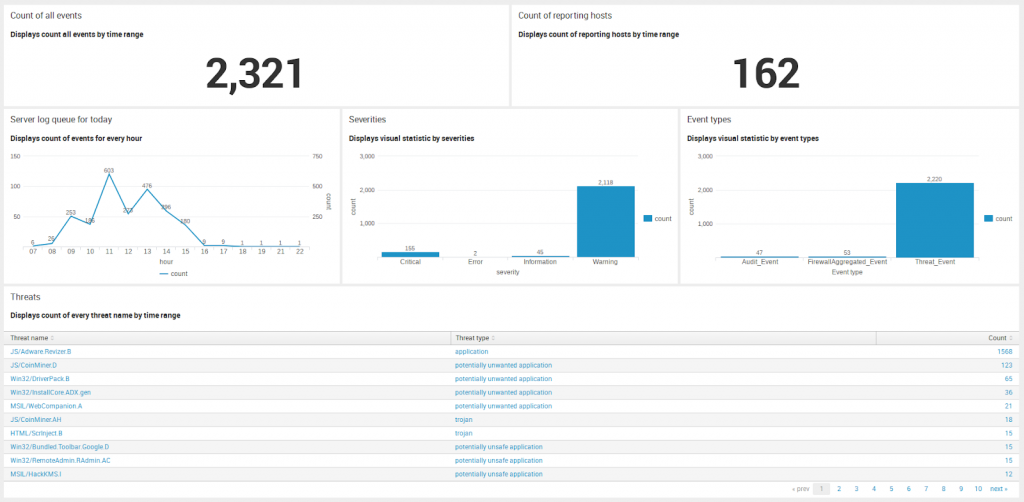
On this screen, you can see the general statistic about all events, detected by Eset Remote Administrator in your network. It’s only short and basic information that can help you to understand all situations. For more details, please visit Threats section.
On every item, you can see the name and the short description of provided value.
Count of all events – count of all events by a selected time range.
Count of reporting hosts – a count of the unique hostnames by a selected time range (it’s not the counting of all computers, that you can see in admin web panel, but just a count of the hostnames.
Server log queue for today – visual statistic by the count of events for every hour using the line chart.
Severities – statistic by severities by selected time range (Critical, Error, Informational, Warning or Fatal).
Event types – visual statistic by event types (Threat Event, Firewall Aggregated Event, Audit Event or HIPS Aggregated Events).
Threats – very useful statistic. They display the count of all threats, detected in your network, and display their threat type(trojan, worm, potentially unwanted application etc.)
Time range you can select at the top of the Dashboards page using Time range selector.
By default on the Dashboard page, you can see the statistic for Today.
Computers
Computers status section
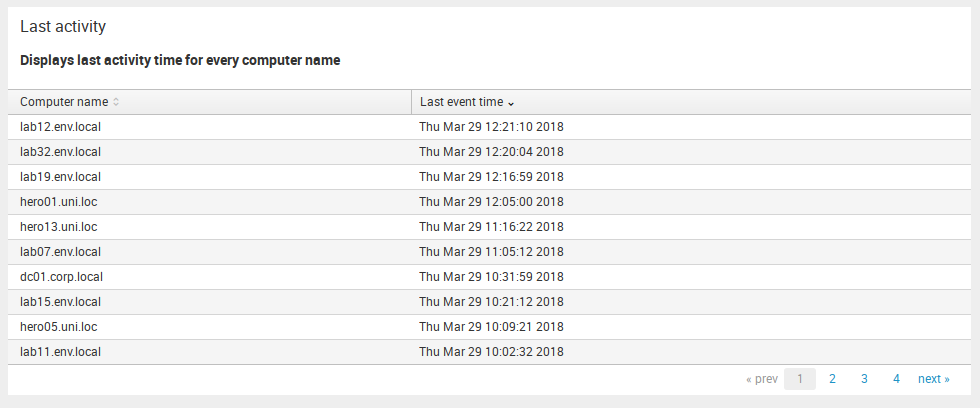
Last activity – in this table you can see last event time for every reporting computer by selected time range. This range you can choose using General time selector.
Threats
This is the most informational part of App for Eset Remote Administrator.
This section consists of Threat Events – Detailed Statistic, Threat Events – Statistic by hostnames, Threat Events – Statistic by threat names, Firewall Aggregated Events and HIPS Aggregated events subsection.
Subsections with prefix “Threat Events” provide information about all the detected threat events. The main and the most informative subsection is Threat Events – Detailed Statistic, but if you need more detailed information, you can visit second and third subsections – Threat Events – Statistic by hostnames and Threat Events – Statistic by threat names.
To get information about Firewall or HIPS events (only if your ERA instance provide this) you should visit Firewall Aggregated Events and HIPS Aggregated Events dashboards.
Threat Events – Detailed Statistic
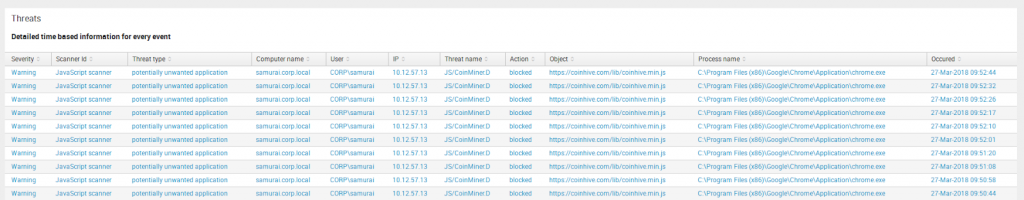
It will be the most often visited dashboard in all app because there is a detailed information about all the threat events such as Threat name, Threat type, Object, Process name, information about hostname (Computer Name, User, IP address), Action thatwas taken by antivirus, Severity and Scanner ID.
You can view info for a specific hostname by using Hostname drop-down.
In case if your Eset Remote Administrator logs are located in the non-default index, you can add search query “index=your_index” in Root search text input (by default only source type defined).
Using Time range selector, you can specify the time range.
Threat Events – Statistic by hostnames
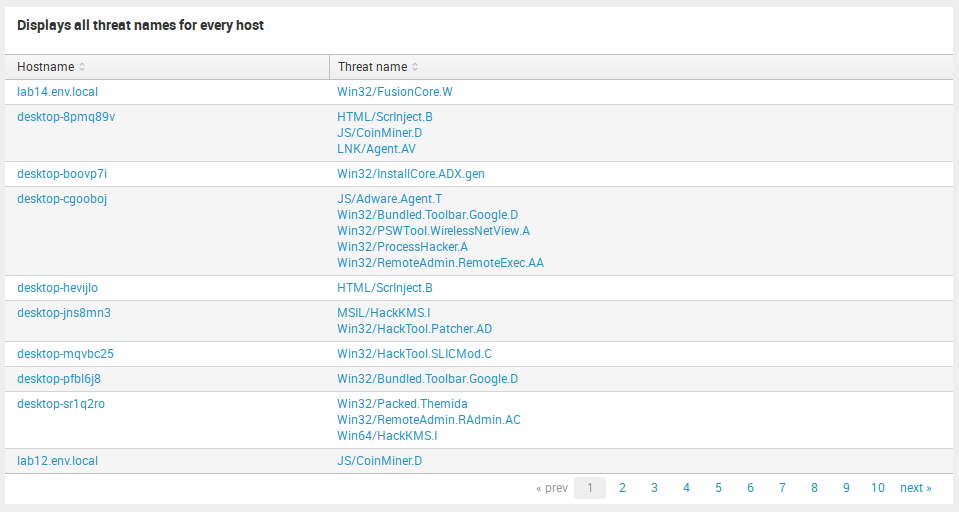
For custom detailed statistic about infected hostnames you can visit Threat Events – Statistic by hostnames.
Here are displayed names of detected threats for every hostname. It may be useful if you want to see the situation about threats in general for each computer.
Threat Events – Statistic by threat names
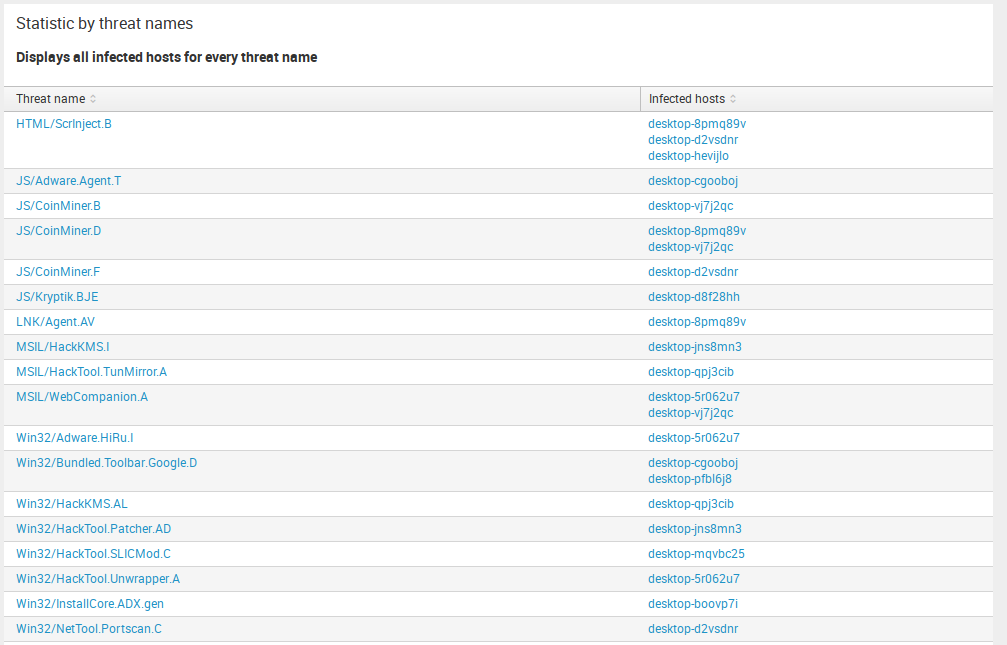
Something like the previous item, you can see a custom detailed statistic about every threat name and infected computers in Threat Events – Statistic by hostnames.
Here are displayed names of computers, infected by specific threat name. For example, to see all infected by JS/CoinMiner. A computer, this table will help you to do it.
Firewall Aggregated Events
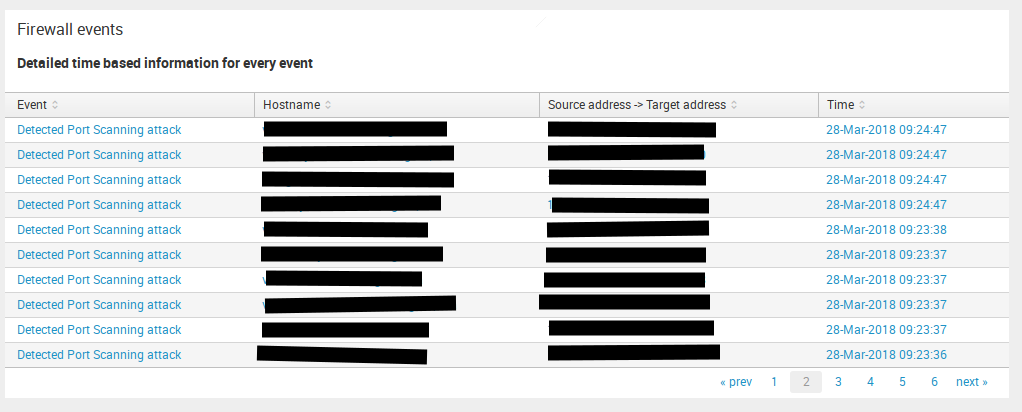
This dashboard can display information about network threats such as Detected Port Scanning attack, Detected ARP cache poisoning attack and something of this kind.
So in this table, you may see Event(network threat), Hostname, Attack Direction(Source address -> Target address) and Time. Don`t look at the small amount of Paint in the screenshot, it`s sensitive information there.
HIPS Aggregated Events
HIPS (Host-based Intrusion Prevention System) provides detection and prevention of unwanted behavior from applications.
This table displays events from Host-based Intrusion Prevention System and provides information about Application, Operation, Action, Target, Rule name, Rule id, and Aggregate count.
Report
This section provides reports about Eset Remote Administrator usage and general short data statistic for events.
Admin panel login attempts
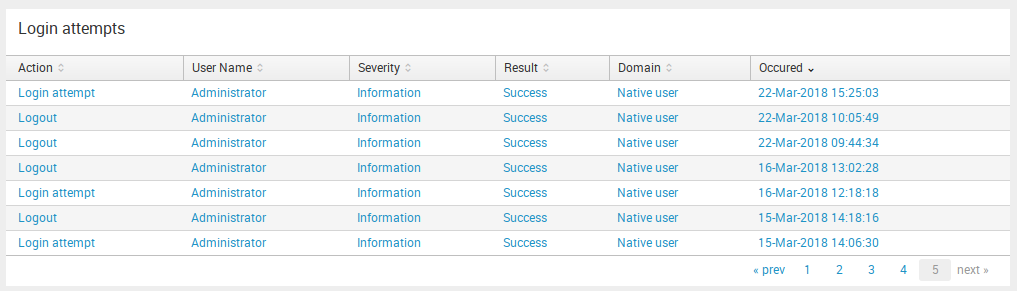
Here you can see all the successful and not successful attempts to log into and log out of your Admin Panel. This table provides information about Action, User Name, Severity, Result of attempt, Domain and Occurred time.
Admin
This section provides information for administrators about this app and about Admin Panel audit events.
App requirements check
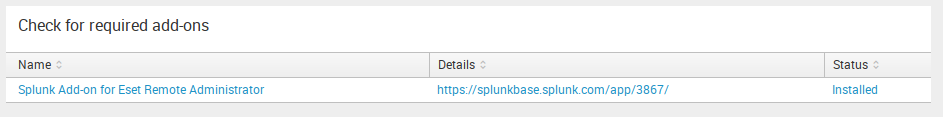
To be sure, that all required dependencies are installed, the app provides for you a table with the list of apps or add-ons and their statuses (Installed or no). It may help you quickly check whether the App will work or not.
Summary
In this article, we described the usage of Splunk Application for Eset Remote Administrator. Also, this article provides the detailed description for every dashboard and usable functions to help you save your time and improve your investigation process.
Big thanks to Splunk for the great resources they provide. Special thanks to portal answers.splunk.com for answering the questions.
Keep your data safe! See you soon. Your UnderDefense team.
Links
App on Splunkbase: https://splunkbase.splunk.com/app/3931/
Our GitHub repository: https://github.com/UnderDefense/Splunk_App_Eset_RA