




Q1. What Is a SOC Benchmark Report, and Why Does “Am I Normal?” Miss the Point?
A SOC benchmark report compares your security operations metrics, including detection speed, response speed, dwell time, false-positive rate, and staffing, against peers in your sector and against maturity standards like SOC-CMM and NIST CSF 2.0. Matching the average is a low bar. A certified network can fall in its first hour of business when the underlying detection is theater rather than real defense.
See a gap between your metrics and the benchmark? We show you what top SOCs do differently and how to close the distance
The 2 a.m. question behind the board deck
I have sat on bridge calls where a CISO stares at a dashboard before a board meeting and asks one quiet question. “Are we normal?”
That question feels safe. It is also the wrong one. The fear underneath it is operational blindness, the worry that the money already spent buys a clean audit and nothing that stops a real attacker.
I have spent fifteen years building security operations centers from the ashes of web-based syslog, database exports, and tools nobody remembers. So I will say this plainly. A network can pass every test and still fail the moment it matters.
“You can get your network certified, you can get an ATO because you’ve done your pentest, and it’ll die the first hour that it’s opened up and running for business, just because the pentest was lame.”
A passing grade on paper does not equal a SOC that catches the intruder at 2 a.m. A lean penetration testing engagement that finds real attack paths is worth more than a checkbox test that clears an audit and nothing else.
What a SOC benchmark report actually measures
A benchmark report puts numbers next to a yardstick. Two yardsticks matter most for mid-market teams.
- SOC-CMM, a maturity model that scores five domains and 27 aspects on a 0 to 5 scale.
- NIST CSF 2.0, which groups your work into Govern, Identify, Protect, Detect, Respond, and Recover.
Against those frames, you measure a handful of metric families:
- Speed: how fast you detect, respond, and contain.
- Quality: how many alerts are false positives.
- Exposure: how long an attacker sits undetected (dwell time).
- Capacity: how many analysts you actually staff.
The benchmark only earns its keep when each number maps to a decision. A number with no decision attached is decoration. Our breakdown of core SOC metrics walks through which numbers drive action.
Why “can I stop a breach?” is the better question
Here is the reframe I push every team toward. Stop asking whether your numbers match the average. Start asking whether your SOC can detect and respond before damage lands.
The average is a comfortable place to hide. Plenty of “average” SOCs would lose to a fast intrusion, because the average itself is shaped by under-resourced teams. Beating the median is not the same as beating an attacker.
This is the lens we used when UnderDefense built this report. We wanted to show whether your SOC can genuinely detect and respond, rather than whether it can pass an audit. A managed detection and response model that acts on what it sees is the difference between a clean report and a stopped breach.
My read, and I have been wrong before, is that the teams who improve fastest treat every metric as a question. Not “are we normal,” but “what would this number cost us in a real incident?” That shift, from comparison to consequence, is where the next sections live. We will define which metrics earn a seat at the table, and which ones are quietly wasting your board’s attention.
Q2. Which SOC Metrics Actually Matter in 2026 (and Which Are Just “Trivia”)?
The SOC metrics that matter tie to a decision: Mean Time to Detect (MTTD), Mean Time to Respond (MTTR), Mean Time to Contain (MTTC), Mean Time to Investigate (MTTI), dwell time, false-positive rate, and detection coverage against MITRE ATT&CK. Metrics that fail to tie to a decision, like a raw vulnerability count, are trivia. When a dashboard never changes what you do on Monday, it is theater.
The test every metric must pass
I have watched a sharp CISO lose a board in ninety seconds. The slide had a big number on it. Nobody in the room knew what to do with that number.
That is the whole problem in one scene.
“When I see people describe metrics, the visuals that they represent often don’t tie to a decision, and that’s your first clue that something’s wrong. That’s just trivia.”
So my filter is simple. If a metric changes a decision, keep it. If it just fills a slide, cut it. A “number of vulnerabilities” count usually fails that test, because it tells the board nothing they can act on.
The metrics worth tracking
Here is the short list I trust, in plain terms.
| Metric | What it measures | The decision it drives |
|---|---|---|
| MTTD | Time from compromise to detection | Where to invest detection coverage |
| MTTI | Time spent investigating an alert | Whether to automate enrichment |
| MTTC | Time to contain a confirmed threat | Response playbook gaps |
| Dwell time | How long an attacker stays hidden | Detection blind spots |
| False-positive rate | Share of alerts that are noise | Tuning and analyst burnout |
| Detection coverage | ATT&CK techniques you can see | Roadmap for new detections |
Each row points at an action. That is the entire point. Our guide to SOC automation shows how to act on these without adding headcount.
Why “MTTR” hides two different SLAs
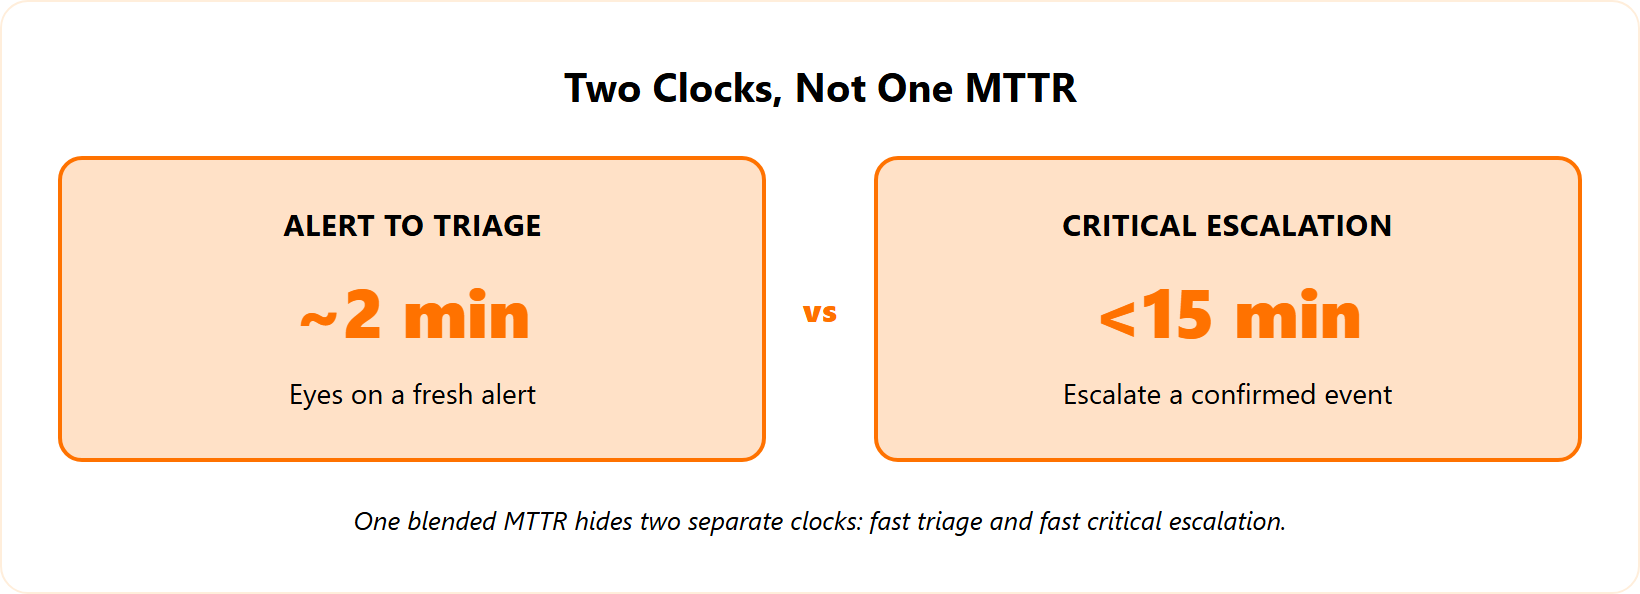
One word causes most of the confusion in this whole field. MTTR. People use it to mean respond, remediate, recover, and contain, all at once. Those are different jobs.
I split it into two honest commitments instead:
- Alert-to-Triage, where the target is roughly 2 minutes to get human or automated eyes on a fresh alert.
- Critical-incident escalation, where the target is under 15 minutes to escalate a confirmed serious event.
When you report a single “MTTR,” you blur those two. A board reading one blended number cannot tell whether you triage fast and escalate slow, or the reverse. Our note on SLAs in cybersecurity explains why these clocks belong apart.
Pick five, and make them count
For a board update, I would carry no more than five metrics. Detection speed. Triage speed. Escalation speed for critical events. False-positive rate. Detection coverage.
That set survives scrutiny because each one ties to money, risk, or staffing.
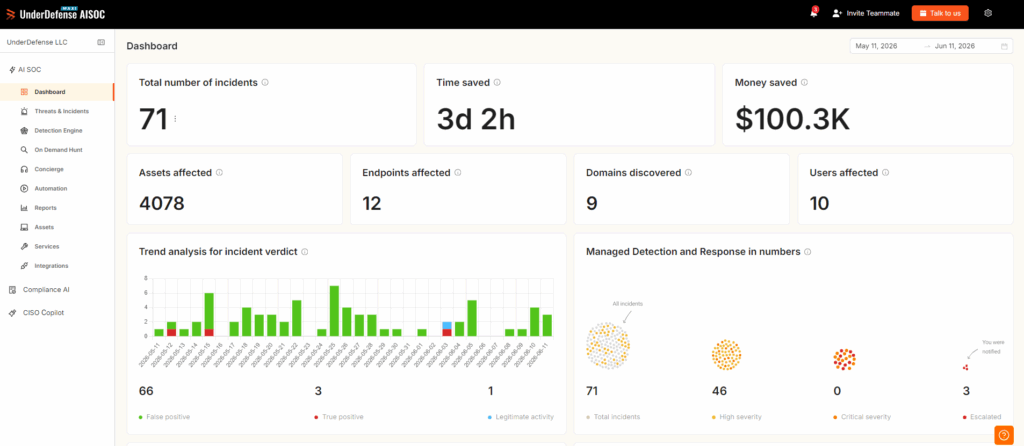
This is also how we tuned the UnderDefense Agentic AI SOC platform. The platform surfaces the metrics that map to a response action, so a busy team chases fewer dashboards and reaches what we call “less glasses of pain.” You can see that workflow logic on the platform itself at https://underdefense.com/platform/.
My honest caution here is that no metric set is universal. Yours should reflect your sector and your real risks. But the decision test holds everywhere. If a number changes nothing, it does not belong on the slide.
Q3. What Do Healthy SOC Benchmark Numbers Look Like (Initial to Elite)?
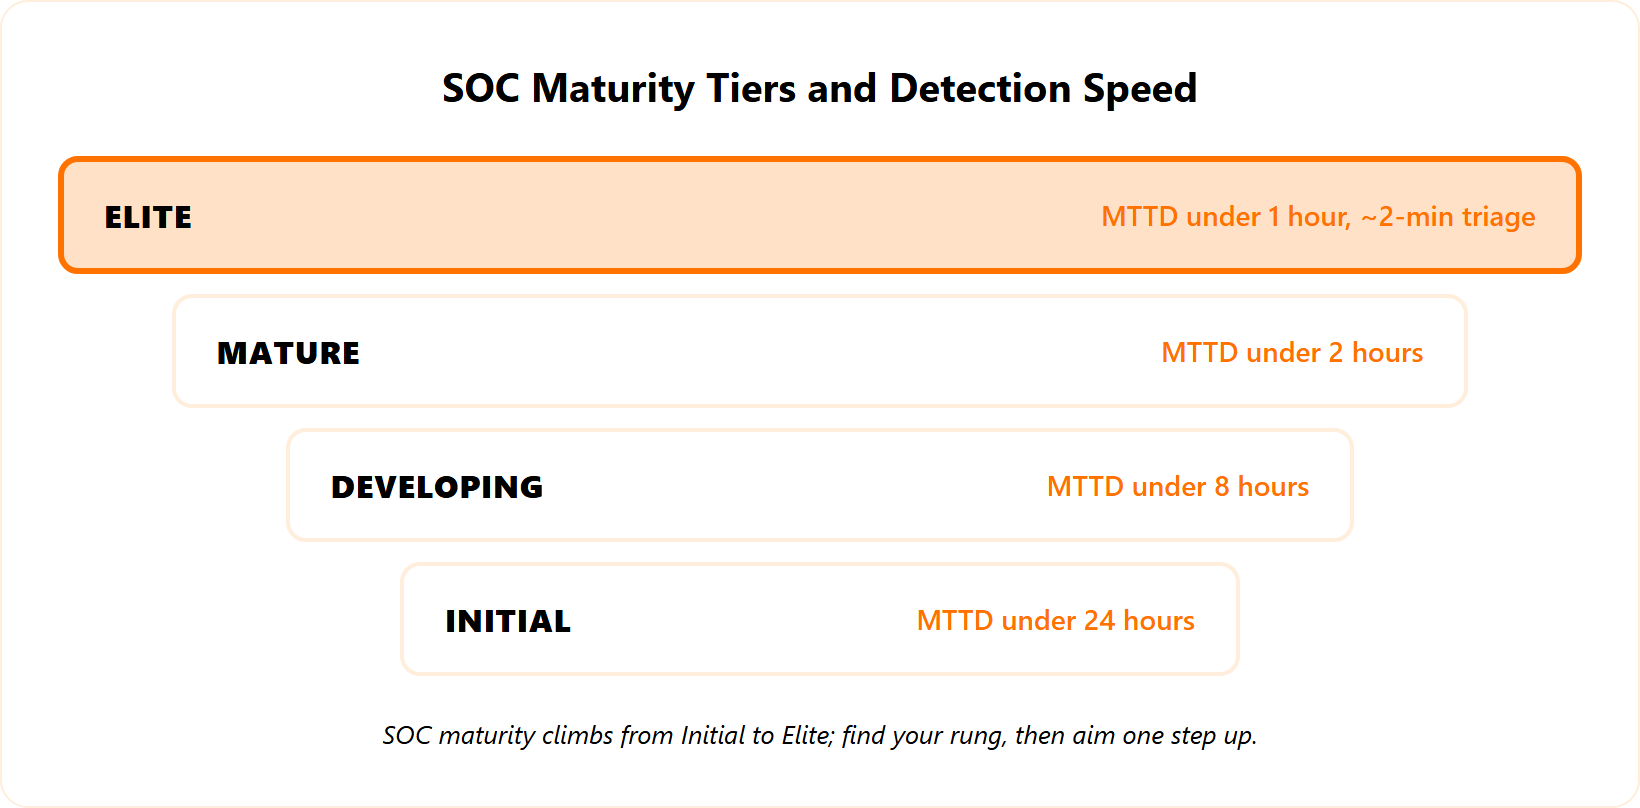
Healthy 2026 SOC benchmarks scale by maturity. Initial tier: MTTD under 24 hours, response under 4 hours, false-positive rate near 50%. Elite tier: MTTD under 1 hour, Alert-to-Triage near 2 minutes, critical-incident escalation under 15 minutes, false-positive rate under 30%, and 95% or more of investigations auto-closed as benign. Match the number to your tier before chasing the elite column.
How to read the table
A benchmark table is useful only when you place yourself honestly first. Most mid-market teams I work with sit somewhere between Developing and Mature, and that is fine. The goal is the next realistic step, rather than a leap to elite numbers your staffing cannot support.
So read each row as a ladder. Find your current rung. Then aim one rung up.
The 2026 tiered benchmark ranges
These ranges reflect what top security-operations guides report for 2026, expressed as practical targets.
| Metric | Initial | Developing | Mature | Elite |
|---|---|---|---|---|
| MTTD | Under 24 hours | Under 8 hours | Under 2 hours | Under 1 hour |
| Alert-to-Triage | Hours | Under 60 min | Under 10 min | Near 2 min |
| Critical escalation | Hours | Under 1 hour | Under 30 min | Under 15 min |
| MTTC | Days | Under 72 hours | Under 24 hours | Under 4 hours |
| False-positive rate | Near 50% | Under 45% | Under 35% | Under 30% |
| Auto-closed benign | Minimal | Some | Majority | 95% or more |
A quick caution. These are directional targets, drawn from published guides rather than a single audited census. Treat them as a map, not a verdict. If you are weighing whether to build this in-house, our look at outsourced versus in-house SOC is a useful companion.
What the “elite” column really takes
The elite column looks clean on a slide. It is brutal to reach with humans alone.
Closing 95% or more of investigations as benign, at speed, is the part most teams underestimate. In our own operations, that figure is real.
“95-plus percent of our investigations, we’re automatically closing items as false positive.”
That is not a humans-typing-faster story. It is automation handling the obvious noise so analysts spend their hours on the few alerts that deserve a brain.
Where to aim next, by tier
Here is how I would set the next target, depending on where you land.
- Initial to Developing: fix detection logic and cut the false-positive flood first. Speed means nothing on bad signal.
- Developing to Mature: tighten triage and define a hard escalation SLA for critical events.
- Mature to Elite: automate enrichment and benign-closure so your scarce analysts stop drowning in routine work.
The elite-tier numbers, a roughly 2-minute Alert-to-Triage and 95%-plus benign auto-closure, are the standard our SOC service is built to hit in production, rather than a brochure claim. You can walk the live workflow at https://underdefense.com/platform/.
My current read is that chasing the elite column out of order backfires. Buy speed before you fix signal quality, and you simply triage garbage faster. Earn each rung, and the next one gets cheaper.
Q4. How Fast Is Fast Enough? Response Speed and Dwell Time vs Attacker Break-In Time
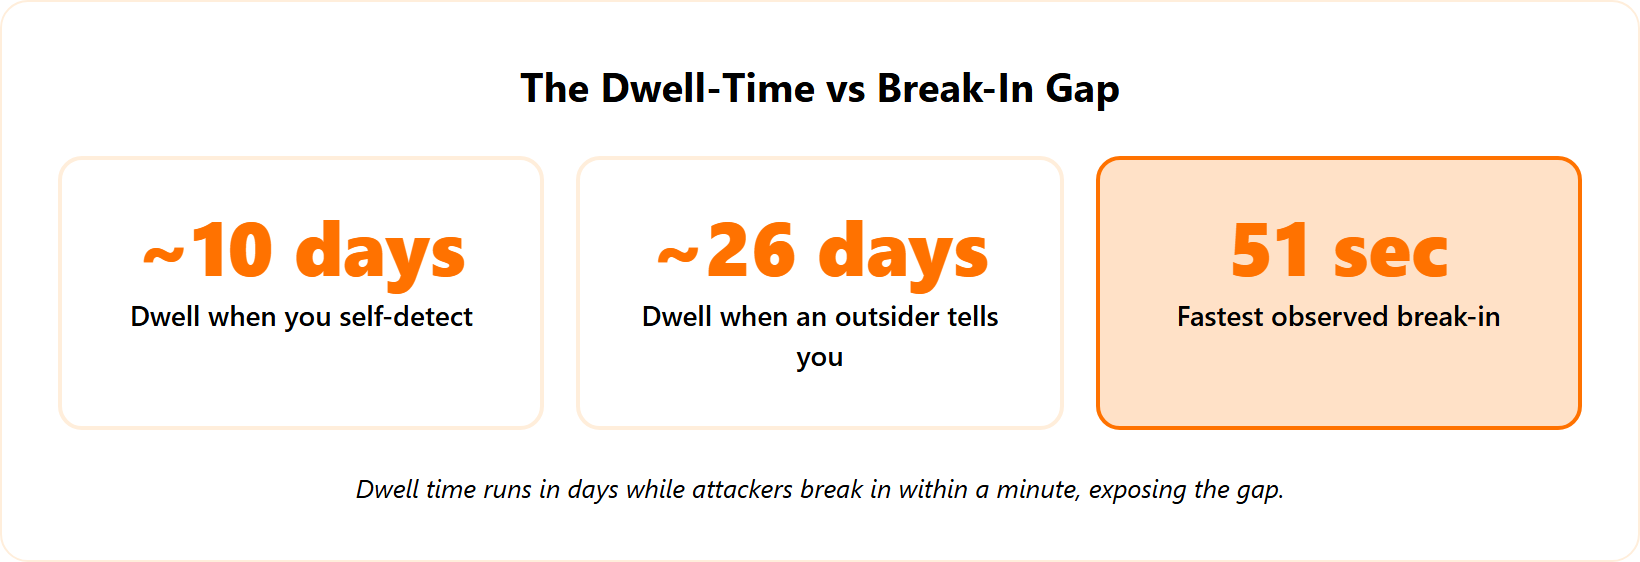
Strong response benchmarks are roughly 2 minutes Alert-to-Triage and under 15 minutes to escalate a critical incident, with automation cutting response time 60% to 90%. Dwell time tells the harder story. Mandiant’s global median rose to 14 days in 2025, but it runs about 10 days when you self-detect versus 26 days when an outsider tells you. The fastest observed break-in is 51 seconds.
The numbers that actually matter for speed
Let me lead with the answer, because speed is where most SOCs quietly lose. Your two real clocks are Alert-to-Triage and critical-incident escalation, and good teams measure them separately.
Automation is the lever here. Published security-operations guidance puts automated response gains at 60% to 90% on the time it takes to act. Our incident response team works that clock every day.
Dwell time, and the question competitors skip
Most benchmark articles stop at one dwell-time number. That misses the sharper signal.
Mandiant’s global median dwell time rose to 14 days in 2025. But the revealing split is who found the breach. Roughly 10 days when you detect it yourself, against 26 days when an external party notifies you.
So the metric I push teams to track is the internal-versus-external detection ratio. It exposes whether your detection is genuinely yours or borrowed from a third party. Attackers know this gap and exploit it after hours.
“The attackers performed active and noisy action only at night to avoid detection, with exfiltration between 1 a.m. and 3 a.m. local time.”
If nobody is truly watching at 2 a.m., your real dwell time is the external number. This is exactly the case for continuous security monitoring.
When the clock is measured in seconds
Now hold those day-long numbers against attacker speed. The contrast is uncomfortable.
The fastest break-in we have observed lands near 51 seconds. Access handoff between criminal groups can happen in well under a minute.
“The fastest break-in time that we’ve seen is somewhere around 51 seconds. Take some time to realign that with security operations expectations in terms of SLAs.”
An SLA written in hours is already lost when the break-in takes a minute. That mismatch is the whole argument for 24/7 coverage and fast, context-rich response.
This is the gap UnderDefense closes with concierge response and round-the-clock coverage, moving teams from the 26-day external-notification reality toward the 10-day self-detection number. One government case where we cut response time to 9 minutes shows what closing that clock looks like in practice. CISOs describe the shift directly.
“It’s reassuring to know they’re always watching for threats. They catch and stop problems quickly, which is a huge relief.”
Serhii B., Chief Information Security Officer UnderDefense G2 Verified Review
“When they escalate something, they include the context we need to understand the issue quickly. We’re not wasting time piecing together what happened from different systems anymore.”
Verified User in Marketing and Advertising, Small-Business UnderDefense G2 Verified Review
What to do Monday: prove your clock works
Here is a concrete test you can run this week. Generate a synthetic transaction, a safe simulated event, and confirm a detection actually fires.
Aim for an alarm condition inside 2 minutes. If it does not fire, you have found a blind spot before an attacker did. If you want a second set of eyes on that gap, you can book a demo and we will walk it with you.
Q5. How Does Your SOC Compare to Peers in Your Sector?
Benchmarks shift sharply by sector. Financial services is one of the most-targeted industries and demands the tightest response SLAs. Healthcare carries heavy dwell-time and compliance exposure. SaaS faces identity-driven attacks, and manufacturing tolerates almost no downtime. A single global average hides this, so compare against your own sector cohort before judging whether your numbers are healthy.
Why a global average lies to your board
I have watched a CISO present “we beat the industry average” with real pride. Then a board member asks, “which industry?” The room goes quiet.
That gap matters. A bank and a factory face different attackers, different clocks, and different costs when something breaks. Blending them into one number tells you almost nothing useful.
What changes from sector to sector
The threat profile, the dwell-time risk, and the cost of downtime all move by industry. Here is how that plays out for the four sectors I see most.
| Sector | Threat pressure | What hurts most |
|---|---|---|
| Financial services | Among the most-targeted industries | Tight response SLAs, regulatory scrutiny |
| Healthcare | High dwell-time exposure | Patient data, compliance penalties |
| SaaS | Identity-driven attacks | Account takeover, customer trust |
| Manufacturing | Lower targeting, low downtime tolerance | Production halts, operational cost |
The downtime number is the one operators underestimate. In hospitality, I have seen the math land hard.
“If the operations stop for even half a day, the company might actually lose around 20K.”
That single figure reframes the whole benchmark conversation. For that business, response speed maps straight to revenue, rather than to a tidy compliance checkbox. Our MDR for financial services and MDR for healthcare exist because those sectors carry very different clocks.
How to pick the right peer cohort
Before your next board deck, anchor your numbers to people who look like you. Three filters do most of the work.
- Industry, because the attacker set and rules differ.
- Company size, because a 600-person team and a 6,000-person team staff very differently.
- Regulatory load, because PCI, HIPAA, or SOC 2 pressure changes your priorities.
Match all three, and your benchmark finally means something. Match none, and you are comparing yourself to strangers. Our guide to MDR services walks through how cohort fit shapes the right model.
Where UnderDefense fits
This is exactly why a one-size benchmark frustrates me. The financial-services attacker moves differently from the manufacturing one, so the detection content and SLAs should differ too.
We tune UnderDefense detection and response to each sector’s threat profile, rather than shipping the same playbook to everyone. A SaaS client gets identity-attack coverage front and center. A manufacturer gets a response clock built around downtime cost.
My honest caveat here is that sector data has limits. Public reports lean toward larger enterprises, so your mid-market reality may run a little behind those numbers. Treat the cohort as a starting line, then adjust for your own size and risk. The point is simple. Stop asking whether you beat “the average,” and start asking whether you beat the average for a company that actually looks like yours.
Q6. How Many People Does a SOC Actually Need? The Real Math Behind 24/7 Coverage
True 24/7/365 SOC coverage needs a minimum of 5 full-time analysts on the barest-bones model, with a realistic target of 9 analysts plus 1 SOC manager. At roughly 30% overhead load, that floor ran about $620,815 per year for five people in 2017 dollars, and materially more today. For most mid-market teams, the staffing math breaks the budget before the tooling does.
The math nobody shows you in the sales deck
Round-the-clock coverage sounds simple until you do the arithmetic. There are 168 hours in a week. One analyst covers maybe 40 of them.
So you cannot run 24/7 with three people and good intentions. The barest-bones model needs at least 5 whole people just to keep one seat always filled. A realistic, sustainable target is 9 analysts plus 1 SOC manager.
What those people actually cost
Headcount is only half the bill. You also pay benefits, training, tools, and overhead on top of salary.
At roughly 30% load on each role, one fully-loaded analyst position ran about $124,163 per year. Stack five of those, and you reach about $620,815 per year, in 2017 dollars. Today that number is higher. You can model your own version with our SOC cost calculator.
And money is not the only constraint. I have watched teams buy great tooling, then leave it half-used because they could not hire the skill to run it. The engines sat idle for lack of skilled drivers. Buying the car does not help if nobody can drive it.
How many alerts can one analyst really handle?
Headcount also depends on noise. An analyst buried under thousands of low-quality alerts burns out fast and misses the real one.
So the honest question pairs two numbers. How many alerts per analyst per shift, and how many of those are real? When that ratio gets ugly, you either add people or fix your signal. Both cost money, so pick deliberately.
Build versus buy, in plain terms
Here is the decision most mid-market leaders actually face. Build a full team in-house, or buy the coverage outcome. Our breakdown of outsourced versus in-house SOC goes deeper on the trade-offs.
- Build: full control, but a $620K-plus staffing floor, hiring delays, and burnout risk.
- Buy: faster coverage, predictable cost, and someone else carrying the on-call pager.
This is where our SOC service earns its place. We deliver the 9-analyst coverage outcome without forcing you to fund and retain that internal staffing floor. Customers tend to describe the relief in human terms.
“It’s reassuring to know they’re always watching for threats. They catch and stop problems quickly, which is a huge relief.”
Serhii B., Chief Information Security Officer UnderDefense G2 Verified Review
It is worth weighing the other side honestly. Some teams report that outsourced models still lean on the internal team for context.
“Arctic Wolf provides solid detection and response capabilities, but overly relies on the client’s team for remediation, which really hurts the value of the service.”
VP of Technology, Services Arctic Wolf Gartner Verified Review
My read is that the staffing math, rather than the tool budget, is what usually forces the build-versus-buy call.
Q7. How Do You Assess SOC Maturity, and Where Is Your Budget Actually Going?
Assess SOC maturity with SOC-CMM: five domains and 27 aspects scored 0 to 5, mapped to NIST CSF 2.0’s Govern, Identify, Protect, Detect, Respond, and Recover functions. Then map your budget dollars onto the NIST CSF risk families on a single page. Many teams discover almost no spend sits in a proactive capacity.
Step 1: Score your maturity with SOC-CMM
You cannot improve what you have not measured. SOC-CMM gives you a clean yardstick, free and widely used.
It scores five domains, business, people, process, technology, and services, across 27 aspects. Each lands on a 0-to-5 scale, where 0 means nonexistent and 5 means optimized. Be honest in the scoring. A flattering self-score helps nobody.
Step 2: Map the domains to NIST CSF 2.0
Next, line your scores up against NIST CSF 2.0. Its six functions give the board language they already recognize.
- Govern: who owns risk decisions.
- Identify: what you are protecting.
- Protect: the controls in place.
- Detect: can you see an attack.
- Respond: can you act on it.
- Recover: can you bounce back.
The Detect function is where most mid-market gaps hide. Weak detection coverage scores low here, even when the dashboards look busy. Our guide to building a SOC covers how to lift that score.
Step 3: Put your budget on one page
Here is the move that surprises people every time. Take your actual budget, and drop each dollar into its NIST CSF function on a single page.
“If I look at NIST CSF and I see the risk families and I allocate my budget dollars into those families, that one-page visual can be really enlightening. I might find that I have zero money being spent in a proactive capacity.”
That one page exposes the blind spot. Most spend clusters in Protect, the tools and licenses. Proactive work, like threat hunting, often shows a near-empty column. Our 2026 cybersecurity budget guide for mid-market firms helps rebalance that spread.
Step 4: Turn the score into a roadmap
A score with no plan is just a grade. Convert it into three moves the board can fund.
- Fix the lowest-scoring domain first, usually Detect or Respond.
- Fund the empty proactive column, even modestly.
- Re-score in six months to prove movement.
This is the assessment our SOC service runs with clients, aligned to SOC-CMM, then we help fill the proactive threat-hunting gap the budget map exposes. The goal is a roadmap your board can act on, rather than a report that sits in a drawer.
My honest caution is that maturity models reward documentation. A team can score well on paper and still respond slowly in a real incident. So pair the score with a live test. Numbers on a slide and behavior at 2 a.m. are not always the same thing. If you want a second set of eyes on where your maturity score and your spend diverge, you can contact us and we will walk it with you.
Q8. Are Your Alerts Really That Bad? Cutting the Investigation Grunt Work
When you are drowning in false positives or letting real threats slip past shallow filters, more AI and more SOAR will not save you. Fix the detection logic first. Once the signal is sound, automation pays off. Enrichment automation can save roughly 8.3 hours per day, and mature pipelines auto-close 95% or more of investigations as false positives, cutting full investigation time to 7 to 8 minutes.
The uncomfortable question first
Let me ask the thing most vendors dodge. Are your alerts really that bad?
Usually the answer is yes. And here is the part nobody wants to hear. No AI in the world saves you from bad detection logic, and SOAR (automated playbooks) will not save you either.
Buy more automation on top of broken signal, and you simply process garbage faster. The fix starts upstream, in the detection rules themselves. Our look at SOC automation shows where it actually helps.
What automation actually saves once the signal is clean
Now flip it. When your detection logic is sound, automation earns its keep fast.
Automated enrichment, gathering the context around an alert, can save roughly 8.3 hours of analyst work for every single day. Mature pipelines push further. They auto-close 95% or more of investigations as false positives, and trim a full investigation down to 7 or 8 minutes.
That is the difference between an analyst drowning and an analyst deciding.
Why one alert is harder than it looks
People imagine investigating an alert is one quick lookup. It is not.
A thorough automated investigation can fire over 100 distinct large-language-model calls to gather and weigh context for a single alert. That is the grunt work humans should never do by hand. The frame I use is simple. AI agents are your foot soldiers, and humans are the generals.
The machine collects context. The human decides. That is the resilient model, and our take on whether AI kills or saves your SOC team goes deeper on it.
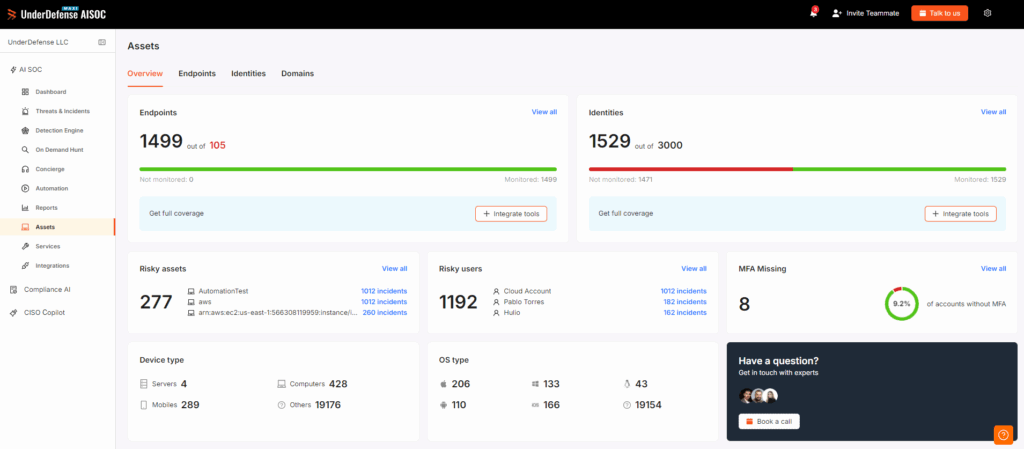
This is exactly how the UnderDefense Agentic AI SOC platform works. It does the enrichment grunt work, then presents the context so a human makes the call.
What customers say, good and bad
The payoff shows up as cleaner escalations.
“When they escalate something, they include the context we need to understand the issue quickly. We’re not wasting time piecing together what happened from different systems anymore.”
Verified User in Marketing and Advertising UnderDefense G2 Verified Review
The category’s honest weak spot is over-automation that closes things without evidence.
“We never get any Defender for endpoint alerts. When we followed up, they stated those alerts were just being closed and resolved without evidence.”
Verified User, Non-Profit Management Red Canary G2 Verified Review
So fix detection first, automate the grunt work second, and keep a human general on the decision. You can see that workflow live on the platform at https://underdefense.com/platform/.
Q9. AI SOC vs Traditional MDR vs Legacy MSSP: How Do You Compare 24/7 Monitoring Options?
Compare 24/7 monitoring options on dollars-for-value rather than feature lists. Legacy MSSPs and monitoring-only tools forward alerts without context. Traditional MDR detects but often hands response back to you. An Agentic AI SOC paired with a human ally both detects and responds with analyst context. The average organization juggles 76 security tools, so integration and actual response decide the winner.
The only question that matters
When a CISO asks me how to choose, I push past the feature checklist fast. The real question is plain.
“I think it’s probably irresponsible if I’m not monitoring 24 by 7. What is the dollars for each option, and what is the value that I get from each option?”
Dollars for value. That filter cuts through the marketing noise in about a minute. Our MDR buyers guide walks through that math step by step.
The 76-tool problem nobody budgets for
Here is a number that explains most of the pain I see. The average organization manages around 76 security tools.
That sprawl is the hidden cost. Every tool adds an alert feed, a login, and a blind spot between systems. A monitoring option that does not integrate with what you already own just adds a 77th thing to babysit.
So integration is a survival feature. I aim for fewer “glasses of pain,” rather than chasing a mythical single pane that swallows your data. Our notes on building a lean security stack show how to trim that sprawl.
The three models, side by side
| Dimension | Legacy MSSP | Traditional MDR | Agentic AI SOC + Human Ally |
|---|---|---|---|
| Detection | Forwards alerts | Detects well | Detects with context |
| Response | Hands it back | Often hands it back | Detects and responds |
| Context | Minimal | Some | Analyst-enriched |
| Transparency | Opaque | Varies | Auditable workflow |
| Integration | Limited | Vendor-leaning | Vendor-agnostic |
The category’s structural weak spot shows up in real reviews.
“Started out well, but over the years the service has consistently not met expectations. Analysts provide little context, and when asked for more information in the investigation nothing is ever provided.”
CISO, Manufacturing Arctic Wolf Gartner Verified Review
“There is still a limit to the environmental knowledge inherent in the service. This leads to a fairly frequent need for engagement with our internal team to get clarification.”
Verified User, Computer Software Expel G2 Verified Review
Which model fits which profile
Here is how I would match the model to the buyer. Our comparison of MSSP providers and SOC-as-a-service options helps narrow the field.
- Tight budget, basic logging need: an MSSP may clear the box, with context as the trade-off.
- Strong in-house team: traditional MDR works if you can absorb the response handoff.
- Lean team, real response gap: an Agentic AI SOC with a human ally fits best.
This last profile is where our managed detection and response sits. We run vendor-agnostic detection with concierge response, so the analyst hands you context and an action, rather than a raw alert and a goodbye.
My honest caveat is that no model is free of trade-offs. The MSSP saves money and costs context. The AI SOC adds response and asks you to trust the workflow, which is why we keep ours auditable.
Q10. What Is SOC ROI Really Worth, and Why Is Proving Breach-Prevention ROI a Trap?
Proving breach-prevention ROI is a trap, because you cannot prove a negative. You can rarely point to the one control that stopped a breach that never happened. Anchor SOC ROI in what you can measure: analyst hours saved, cost avoided through automation, and incidents surfaced. One MDR rollout accidentally uncovered a payroll fraud worth $300K in its first three months.
Why “the breach we prevented” is a dead end
I have watched smart CISOs torch a budget cycle trying to prove a negative. They build a slide claiming “we stopped X breaches.” The board rightly asks how they know.
They cannot know. Proving you prevented a breach means proving something that never happened, which no honest model survives. So stop chasing that number. It makes you look weaker, rather than stronger.
What you can actually measure
Real ROI lives in observable outcomes. These three hold up under a CFO’s questions.
- Analyst hours saved: automation doing the grunt work, counted in real hours.
- Cost avoided: faster containment lowers incident cost, and IBM’s 2025 research ties speed and automation to large savings per breach.
- Incidents surfaced: real things you found that you would have missed.
That last category produces the stories boards remember.
“We saved 300K during the first three months, because it was a fraud that we accidentally discovered.”
Nobody bought monitoring to catch payroll fraud. The visibility caught it anyway. That is measurable value, sitting in dollars you can name. One SIEM and SOC engagement that avoided a $650K loss shows the same pattern.
This is what the UnderDefense Agentic AI SOC platform ROI dashboard quantifies, analyst time saved and cost avoided, rather than an unprovable prevented-breach figure. Customers describe the relief in concrete terms.
“It’s reassuring to know they’re always watching for threats. They catch and stop problems quickly, which is a huge relief.”
Serhii B., Chief Information Security Officer UnderDefense G2 Verified Review
“Alert Logic never correctly identified a single critical-security concern while we had the product. We always had to notify them there was an issue.”
Security Analyst, Software Alert Logic Gartner Verified Review
A defensible ROI model for the board
Here is the model I would bring to a board, in three lines.
- Hours saved, times loaded analyst cost, equals labor ROI.
- Faster containment, times average incident cost, equals avoided cost.
- Incidents surfaced, listed plainly, equals found value.
My read is that this honest math beats the heroic “breaches prevented” claim every time. It is smaller on the slide, but it survives scrutiny. And surviving scrutiny is the whole point when the CFO is in the room.
Q11. How Should You Report SOC Performance to a Board That’s Tired of Metrics?
Boards are fatigued by technical metrics they neither understand nor act on. Lead with the story, where you were, where you are, where you are heading, backed by a few decision-tied numbers and a financial-exposure figure such as a 40% cut in loss exposure over six months. Then add the AI-governance gap. Roughly 97% of AI-related breaches lacked proper AI access controls, and shadow AI added about $670K per breach.
Situation: the board has stopped listening
Picture the quarterly board meeting. The CISO loads a dense metrics slide, and three directors quietly check their phones.
“The CISO responds with this highly technical set of metrics they neither care for nor understand.”
That is the failure. A correct number that triggers no decision is wasted breath in that room. This is one reason a virtual CISO can help translate the data into board language.
Complication: two camps, both partly right
There are two schools on how to fix this, and they pull against each other.
- The narrative camp says lead with the story. “Here is where we were, here is where we are.”
- The financial camp says translate everything into money, like a “40% reduction in total cyber loss exposure over six months.”
Both have a point. The narrative gives context. The financial figure gives the board a number they own.
Resolution: lead narrative, anchor in money, add the new gap
So I blend them. Open with the arc, then anchor it with two or three numbers tied to a decision and one exposure figure.
Then add the metric boards are starting to ask about: AI governance. The 2025 data is sharp here. About 97% of AI-related breaches lacked proper AI access controls, and shadow AI, the unsanctioned tools employees adopt quietly, added roughly $670K per breach.
A board that hears “we have visibility into AI access and shadow AI” relaxes in a way a vulnerability count never delivers. This is the reporting UnderDefense helps CISOs build, narrative plus financial exposure plus AI-asset visibility, rather than a raw vulnerability dump. Our work on MDR for AI covers that emerging gap.
A hybrid board-report template
Here is the one-page structure I would hand a CISO.
- One slide of arc: past, present, next quarter.
- Three decision-tied numbers, like triage speed and detection coverage.
- One financial-exposure figure in dollars.
- One AI-governance line: shadow AI exposure and access-control status.
My honest caveat is that the financial figure invites challenge. A board may push on how you modeled the 40%. So show your assumptions on a backup slide, rather than hiding them. Transparency on the math is what earns the next budget ask. If you want help shaping that story, you can book a demo and we will walk it with you.
Q12. What Should You Do Monday Morning to Close Your Biggest SOC Gap?
Start Monday with three moves. Run a synthetic transaction to prove a critical detection fires in under two minutes. Map your budget onto the NIST CSF families to expose proactive blind spots. Check your Google OAuth consent grants for free shadow-IT discovery. You will not “win” cybersecurity, because it behaves like a zombie apocalypse, but you can stop being the easy target.
Three moves you can run this week
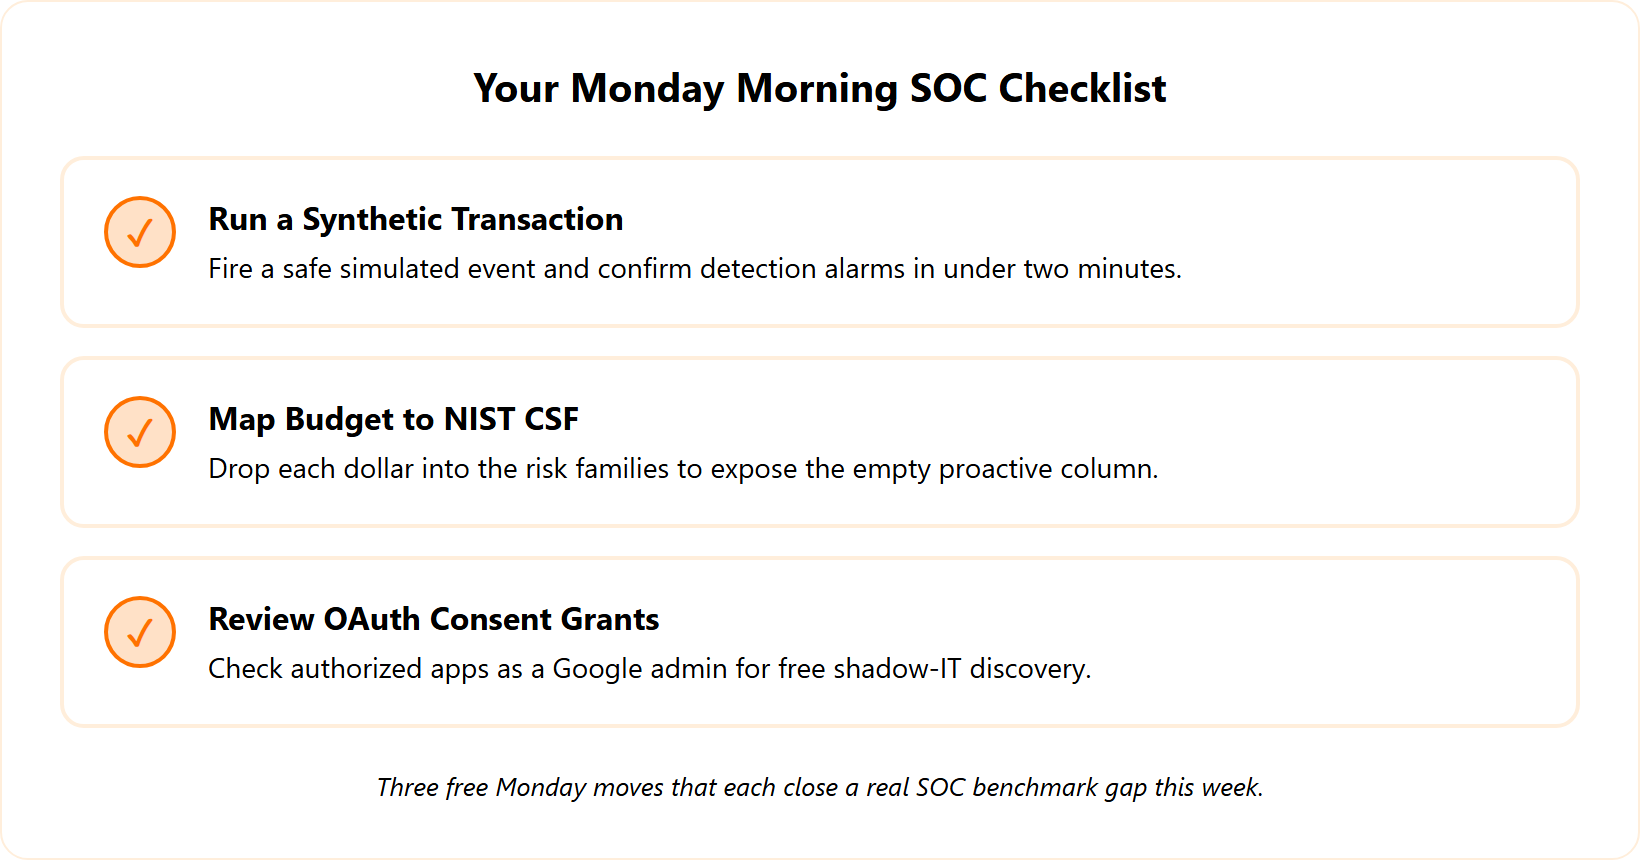
You do not need a new budget to start. You need three hours and some honesty.
- Run a synthetic transaction. Fire a safe, simulated event and confirm your detection actually alarms. Aim for under two minutes. If it stays silent, you found a blind spot before an attacker did.
- Map your budget to NIST CSF. Drop each dollar into Govern, Identify, Protect, Detect, Respond, and Recover on one page. You will likely see a near-empty proactive column.
- Check Google OAuth consent grants. As a Google admin, you can see every app users authorized.
That third move is free shadow-IT discovery most teams overlook.
“As a Google admin, you can see all of those websites where people have authenticated. It’s a really rich source of vendors you don’t know about.”
Each step moves a real benchmark. Synthetic transactions test detection speed. The budget map fixes proactive coverage. The OAuth review shrinks your unknown attack surface. Our guide to external attack surface management goes deeper on that last one.
The honest closing thought
Here is the part the category avoids saying out loud. You do not win this game.
“You don’t win in cybersecurity. It’s like a zombie apocalypse.”
The goal is resilience, rather than a final victory. You make yourself a harder target, you detect faster, and you recover well when something lands. A solid incident response plan is part of that resilience.
If your benchmark hurt somewhere specific, that is the useful signal. Tell us where it stung most, and our SOC service can run the SOC-CMM-aligned maturity assessment and stand up the response layer you are missing. UnderDefense exists for exactly that conversation.
My current read on the next 18 to 24 months is that the teams who pair automation with sharp human judgment will pull ahead. The machines handle the grunt work. The humans make the calls. Being a human, with context and judgment, is a real flex in 2026. So which of those three Monday moves are you running first?
Ready to move your numbers up a tier? Our Agentic AI SOC cuts noise by about 99%, so your team performs like a bigger one
1. What are healthy SOC benchmark numbers for 2026?
We see healthy 2026 benchmarks scale by maturity tier rather than a single universal target. Reading them honestly matters more than chasing the elite column out of order.
- Initial: MTTD under 24 hours, response measured in hours, false-positive rate near 50%.
- Developing: MTTD under 8 hours, Alert-to-Triage under 60 minutes, false-positive rate under 45%.
- Mature: MTTD under 2 hours, escalation under 30 minutes, majority of benign alerts auto-closed.
- Elite: MTTD under 1 hour, roughly 2-minute Alert-to-Triage, critical escalation under 15 minutes, false-positive rate under 30%, and 95% or more of investigations auto-closed as benign.
In our own operations, automatically closing 95-plus percent of investigations as false positives is real, and it comes from automation handling the noise so analysts focus on the few alerts that deserve a brain. We always recommend fixing detection logic and false-positive volume before buying speed, because triaging garbage faster helps nobody. Our breakdown of core SOC metrics shows which numbers actually drive action, so you aim one realistic rung up rather than leaping to numbers your staffing cannot support.
2. What is a good mean time to respond benchmark for a SOC?
We push teams away from a single blended mean time to respond number, because it hides two very different jobs. One clock measures how fast you get eyes on a fresh alert, and the other measures how fast you escalate a confirmed serious event.
So we report two honest commitments instead:
- Alert-to-Triage: a target of roughly 2 minutes to get human or automated attention on a new alert.
- Critical-incident escalation: under 15 minutes to escalate a confirmed critical event.
Why split them? A board reading one averaged MTTR cannot tell whether you triage fast and escalate slow, or the reverse. Automation is the lever that moves both, with published guidance putting automated response gains at 60% to 90% on the time it takes to act.
Hold those clocks against attacker speed. The fastest break-in we have observed lands near 51 seconds, so an SLA written in hours is already lost. This is exactly the gap our incident response team closes with round-the-clock coverage and context-rich escalation, moving teams toward the self-detection reality rather than waiting for an outsider to call.
3. How many people does a 24/7 SOC actually need?
We do the arithmetic up front, because round-the-clock coverage breaks most budgets before tooling does. There are 168 hours in a week, and one analyst covers maybe 40 of them.
So the math looks like this:
- Barest-bones model: a minimum of 5 full-time analysts just to keep one seat always filled.
- Realistic, sustainable target: 9 analysts plus 1 SOC manager.
- Fully-loaded cost: at roughly 30% overhead, the five-person floor ran about $620,815 per year in 2017 dollars, and materially more today.
Headcount also depends on noise. An analyst buried under thousands of low-quality alerts burns out and misses the real one, so the honest question pairs alerts-per-analyst with how many are actually real.
This is where the build-versus-buy decision gets sharp. Building gives control but a $620K-plus floor, hiring delays, and burnout risk. Buying delivers the coverage outcome with predictable cost. You can model your own version with our SOC cost calculator, then weigh whether funding that internal staffing floor makes sense for your team.
4. How do you assess SOC maturity?
We assess SOC maturity with a structured, honest scoring process rather than a flattering self-grade. The goal is a roadmap your board can fund, not a report that sits in a drawer.
Our approach runs in steps:
- Score with SOC-CMM: five domains across 27 aspects, each on a 0-to-5 scale where 0 is nonexistent and 5 is optimized.
- Map to NIST CSF 2.0: align scores to Govern, Identify, Protect, Detect, Respond, and Recover, the language boards already recognize.
- Map your budget onto those families: drop each dollar onto one page and expose the gaps.
That one-page budget map is the enlightening part. Most spend clusters in Protect, while the proactive threat-hunting column often shows almost nothing. The Detect function is where most mid-market gaps hide, even when dashboards look busy.
One honest caveat: maturity models reward documentation, so a team can score well on paper and still respond slowly at 2 a.m. We pair the score with a live test for that reason. Our guide to building a SOC walks through how to lift the lowest-scoring domain first.
5. Which SOC metrics and KPIs actually matter in 2026?
We apply one filter to every metric: if it changes a decision, we keep it; if it just fills a slide, we cut it. A raw vulnerability count usually fails that test because it tells the board nothing they can act on.
The KPIs we trust, each tied to an action, are:
- MTTD: time from compromise to detection, guiding where to invest detection coverage.
- MTTI: investigation time, signaling whether to automate enrichment.
- MTTC: time to contain, exposing response playbook gaps.
- Dwell time: how long an attacker stays hidden, revealing blind spots.
- False-positive rate: alert noise that drives tuning and burnout.
- Detection coverage: MITRE ATT&CK techniques you can actually see.
For a board update, we carry no more than five: detection speed, triage speed, critical escalation speed, false-positive rate, and detection coverage. That set survives scrutiny because each one ties to money, risk, or staffing. No metric set is universal, so yours should reflect your sector, but the decision test holds everywhere. Our work on SOC automation shows how to act on these without adding headcount.
6. How does SOC performance compare across different sectors?
We resist the single global average, because a bank and a factory face different attackers, different clocks, and different costs when something breaks. Blending them tells you almost nothing useful.
Here is how the pressure shifts by sector:
- Financial services: among the most-targeted industries, demanding the tightest response SLAs and heavy regulatory scrutiny.
- Healthcare: high dwell-time and compliance exposure around patient data.
- SaaS: identity-driven attacks and account takeover threatening customer trust.
- Manufacturing: lower targeting but near-zero downtime tolerance, where a halt costs real production revenue.
The downtime number is the one operators underestimate. In hospitality, we have seen half a day of stopped operations cost roughly 20K, which maps response speed straight to revenue rather than a compliance checkbox.
So we anchor benchmarks to a real peer cohort using three filters: industry, company size, and regulatory load. Match all three and the number finally means something. We tune our detection and response to each sector’s threat profile rather than shipping the same playbook to everyone, because the right SLAs differ by industry.
7. How do you prove SOC ROI to a CFO or board?
We treat proving breach-prevention ROI as a trap, because you cannot prove a negative. Claiming you stopped breaches that never happened collapses under a CFO’s questions and makes you look weaker, not stronger.
Instead, we anchor ROI in what you can actually measure:
- Analyst hours saved: automation doing the grunt work, counted in real hours times loaded analyst cost.
- Cost avoided: faster containment lowering incident cost, which IBM’s 2025 research ties to large per-breach savings.
- Incidents surfaced: real things you found that you would have missed.
That last category produces the stories boards remember. One MDR rollout accidentally uncovered a payroll fraud worth $300K in its first three months, because the visibility caught what nobody bought it to catch.
For board reporting, we lead with the arc, where you were, where you are, where you are heading, then anchor it with two or three decision-tied numbers and one financial-exposure figure. We also add the AI-governance line boards now ask about. This honest math beats the heroic prevented-breach claim every time. Our SOC service quantifies time saved and cost avoided rather than an unprovable figure.
8. What is the difference between an AI SOC, traditional MDR, and a legacy MSSP?
We compare 24/7 monitoring options on dollars-for-value rather than feature lists, because that filter cuts through the marketing noise fast.
The three models differ most on what happens after detection:
- Legacy MSSP: forwards alerts with minimal context and hands response back to you.
- Traditional MDR: detects well but often still hands response to your team.
- Agentic AI SOC with a human ally: detects and responds with analyst-enriched context and an auditable workflow.
Integration is a survival feature here, because the average organization juggles around 76 security tools. A monitoring option that does not connect to what you already own just adds a 77th thing to babysit.
We match the model to the buyer: an MSSP fits a tight budget with context as the trade-off, traditional MDR suits a strong in-house team that can absorb the handoff, and an AI SOC with a human ally fits a lean team facing a real response gap. No model is free of trade-offs, which is why we keep our MDR buyers guide focused on the dollars-for-value math rather than feature checklists.