


Intro
Working for our client with a database hosted on Amazon, we have faced the case of forwarding MySQL log files in AWS to Splunk in order to monitor connections to the DB. According to safety measures it was important to detect unusual user activity in case somebody was trying to login after working hours, from distrustful locations, suspicious IPs, etc. The peculiarity of this case is that the MySQL database was hosted on Amazon RDS and there is few information how to deal with such situations.
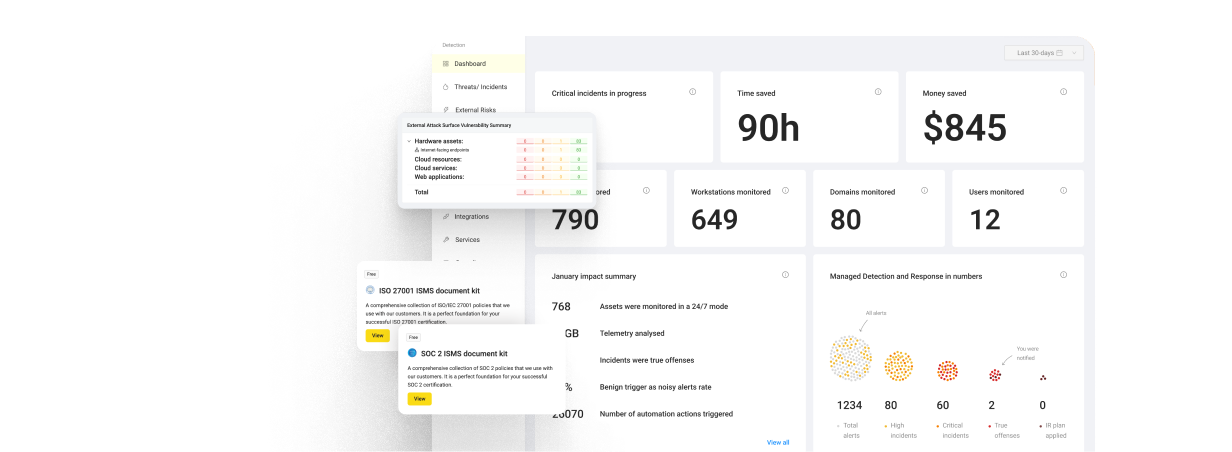
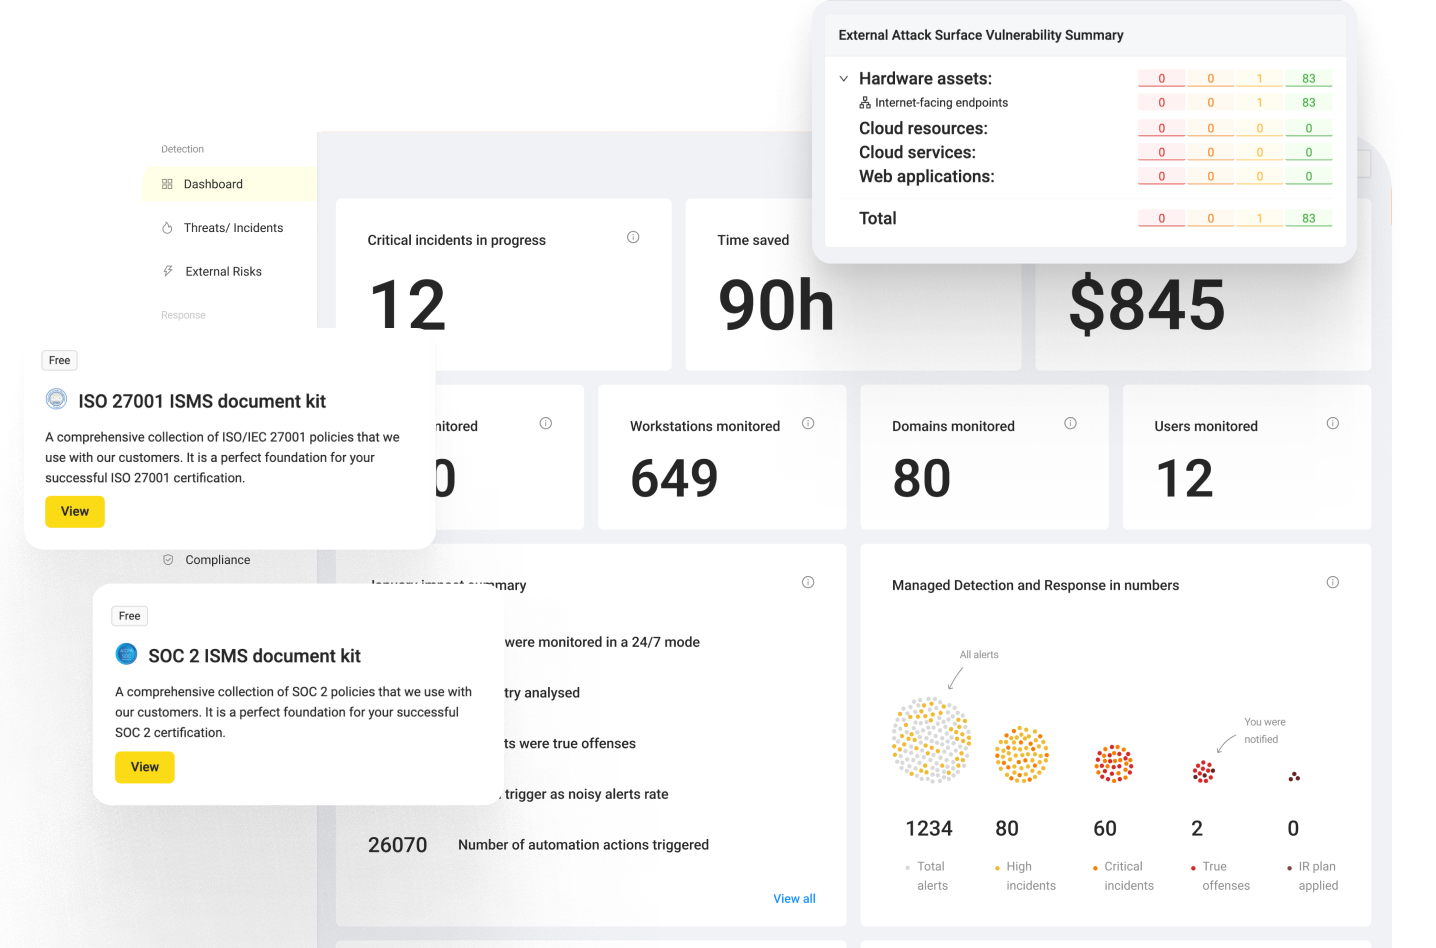
The bruteforce attacks and unwanted user connections to database are the most common threats that adversaries use to steal important data. Using a SIEM tool ( Splunk ) we solved this problem of tracking unusual user activity to a large number of AWS services fast and easy.
This article will be useful for Security Engineers, AWS Cloud Engineers and anyone who is interested in security monitoring. For you to configure it instantly, read our step by step guide below.
Attention! Check this solution in the testing environment before applying to your production.
[Explore an Educational Hub with answers to the trickiest questions. Subscribe to UnderDefense YT channel and receive a resource with practical knowledge sharing]
AWS Configuration part
First of all we need to enable logging for our RDS instance and configure sending logs to CloudWatch.
Step 1. Enable RDS logging
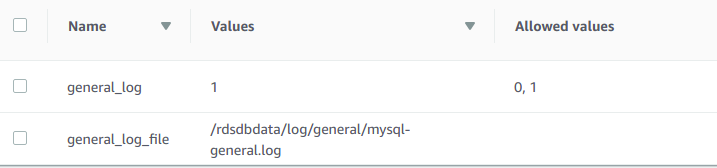
Go to Parameter groups in RDS panel and configure these parameters – general_log, general_log_file, log_output and set it as indicated below in the table. There are too many settings, so we advice to type General in Search field to find these parameters faster.
general_log=1
general_log_file may be default.
log_output = FILE

When our RDS instance logging is configured, next step is to continue and publish logs to CloudWatch Logs.
Step 2. Publish MySQL logs to CloudWatch Logs
Open the Amazon RDS console.
In the navigation pane, choose Instances, and then select the RDS instance that you want to modify.
For Instance actions, choose Modify.
In the Log exports section, choose the logs you want to start publishing to CloudWatch Logs (General log in our case).
Choose Continue, and then choose Modify DB Instance on the summary page.
Review RDS logs
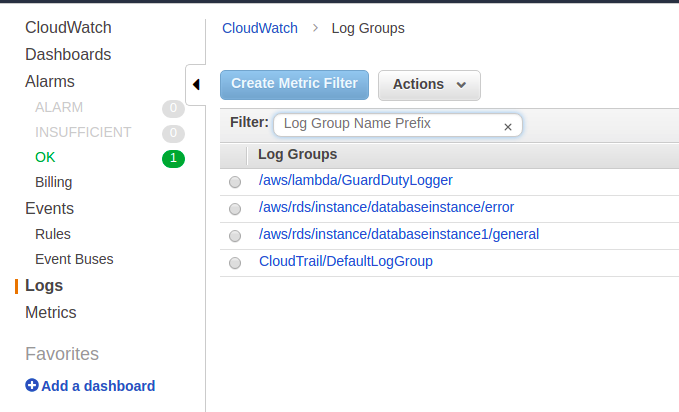
Open CloudWatch, go to Logs and select your logs group. It will be something like this “aws/rds/instance/database_name/general”
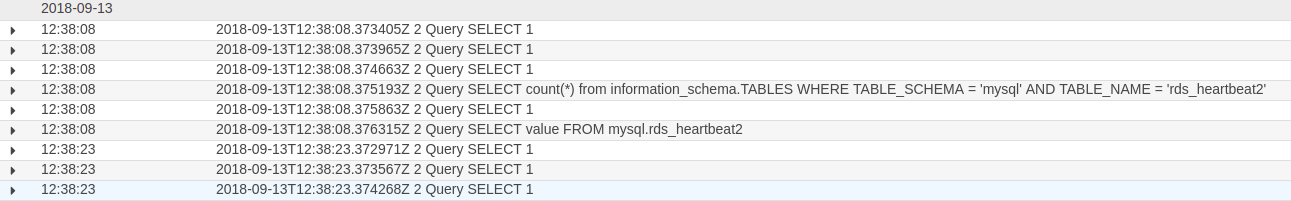
Click on this Log Group and select your log stream (database instance1 in our case).
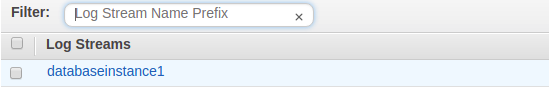
Here you can see all database logs.
At this place the first part is done. The AWS environment is configured. Let’s configure the Splunk part.
Splunk configuration part
The main task here is to configure Splunk inputs in order to collect RDS logs from AWS environment, as our main challenge is to forward MySQL log files in AWS to Splunk.
Before we start, you should have Splunk TA for AWS installed.
Step 1. Filtering and parsing configuration
Open SSH session to your instance.
Go to $SPLUNK_HOME$/etc/apps/Splunk_TA_aws/local
If props.conf exist, add the following at the end of the file (if the file doesn’t exist, you need to create it).
[aws:rdsmon:whitelist]
DATETIME_CONFIG =
NO_BINARY_CHECK = true
SHOULD_LINEMERGE = false
LINE_BREAKER = ([\r\n])+(\d{4}-\d{2}-\d{2})
TRUNCATE = 300
TRANSFORMS-set= setnullaws,setparsingaws
category = Custom
description = Sourcetype using data whitelisting. Collect whitelisted only.
pulldown_type = 1
disabled = false
EXTRACT-session_id,username,hostname = ^[^\t\n]\t\s+(?P\d+)[^’\n]‘(?P[^’]+)’@'(?P[^’]+)
Add the following to transforms.conf (in the same directory)
[setnullaws]
REGEX = Query|Statistics|Execute|fictypediagnostic
DEST_KEY = queue
FORMAT = nullQueue
[setparsingaws]
REGEX = Connect
DEST_KEY = queue
FORMAT = indexQueue
aws:rdsmon:whitelist – it is a sourcetype for this data. You can find RDS logs using it.
Note: if you want to monitor not only connections to your database, but all events in general log, remove TRANSFORMS-set= setnullaws,setparsingaws from props.conf
Restart Splunk Enterprise instance using CLI or in your web panel.
Step 2. Inputs configuration
Open Splunk Add-on for AWS

Go to Inputs and click on Create New Input -> Custom Data Type -> CloudWatch Logs
Fill out the fields as in the example (look screenshot).
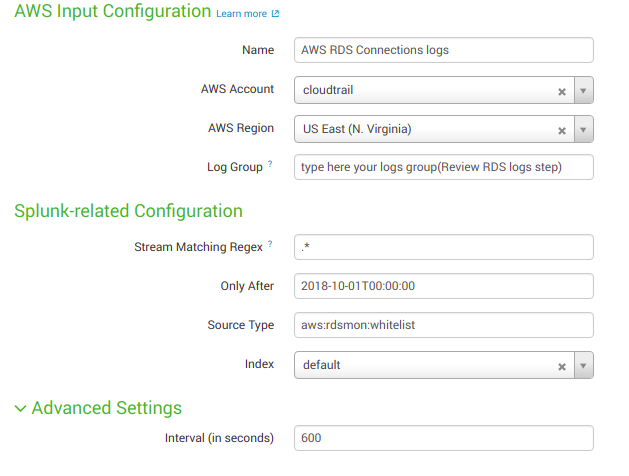
Name: input name for your Data Input.
AWS Account: Account, configured in Configuration section of Splunk Add-on for AWS (don`t forget to add account)
AWS Region: Location of your resources (you can add only one region for every Data Input)
Log Group: It will be something like
this “aws/rds/instance/database_name/general”
Stream Matching Regex: A comma-separated list of log group names.
Only after: GMT time string in ‘%Y-%m-%dT%H:%M:%S’ format. If set, only events after this time are queried and indexed. Defaults to 1970-01-01T00:00:00.
Source Type: A source type for the events. Enter “aws:rdsmon:whitelist”.
Index: The index name where the Splunk platform puts the CloudWatch Logs data. The default is main.
Next click Save.
Congratulations! We’ve finished connecting AWS CloudWatch logs to Splunk.
Searching
Open Search and reporting application in your Splunk Search Head and type this query in search field to get all RDS connections logs.
index=”aws_logging” sourcetype=”aws:rdsmon:whitelist”
Summary
In this article, we provided a solution for monitoring connections to database instance hosted on AWS RDS. This helped as to solve our challenge of forwarding MySQL log files in AWS to Splunk.
Big thanks to Splunk and AWS for the great resources they provide.
Keep your data safe! Learn more about our Security Operations Center.
[Let’s get in touch if you want to learn more about UnderDefense trainings and services, and receive updates with educational content]